January 5, 2023
Fixing Flexport's Navigation Menu
While I was on Flexport’s site, I was playing around with the navigation bar when I noticed something a little bit off. The components on the navigation bar responded to my actions a bit slowly. It seemed like there was a delay on each event listener on the navigation menu.
I got curious to look more into the issue. I noticed that they used React.js on their front-end (by using the React dev tools)
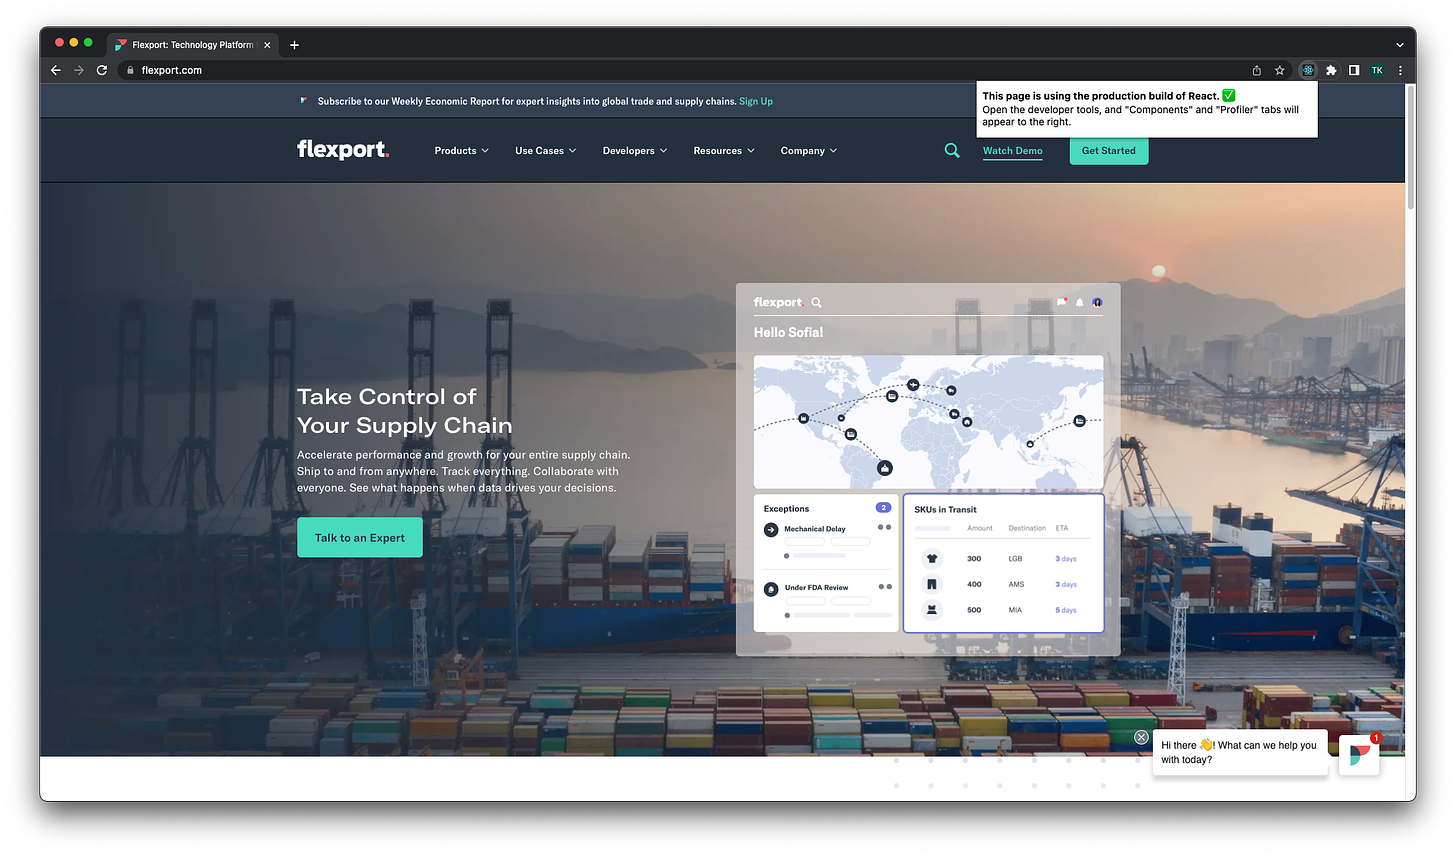
Amongst many things, I looked at how the components’ states were managed. A lot of component updates on one event listener can cause performance issues, and these issues are common on many websites. This mostly happens when there is one large component that manages a lot of states and propagates these states to child components.
Using the React dev tools, I can see how many component re-renders are triggered. The React dev tools draw a square around each component that re-renders. As you can see from the image below, one event listener caused many other components to re-render (even some that are not visible on the viewport).
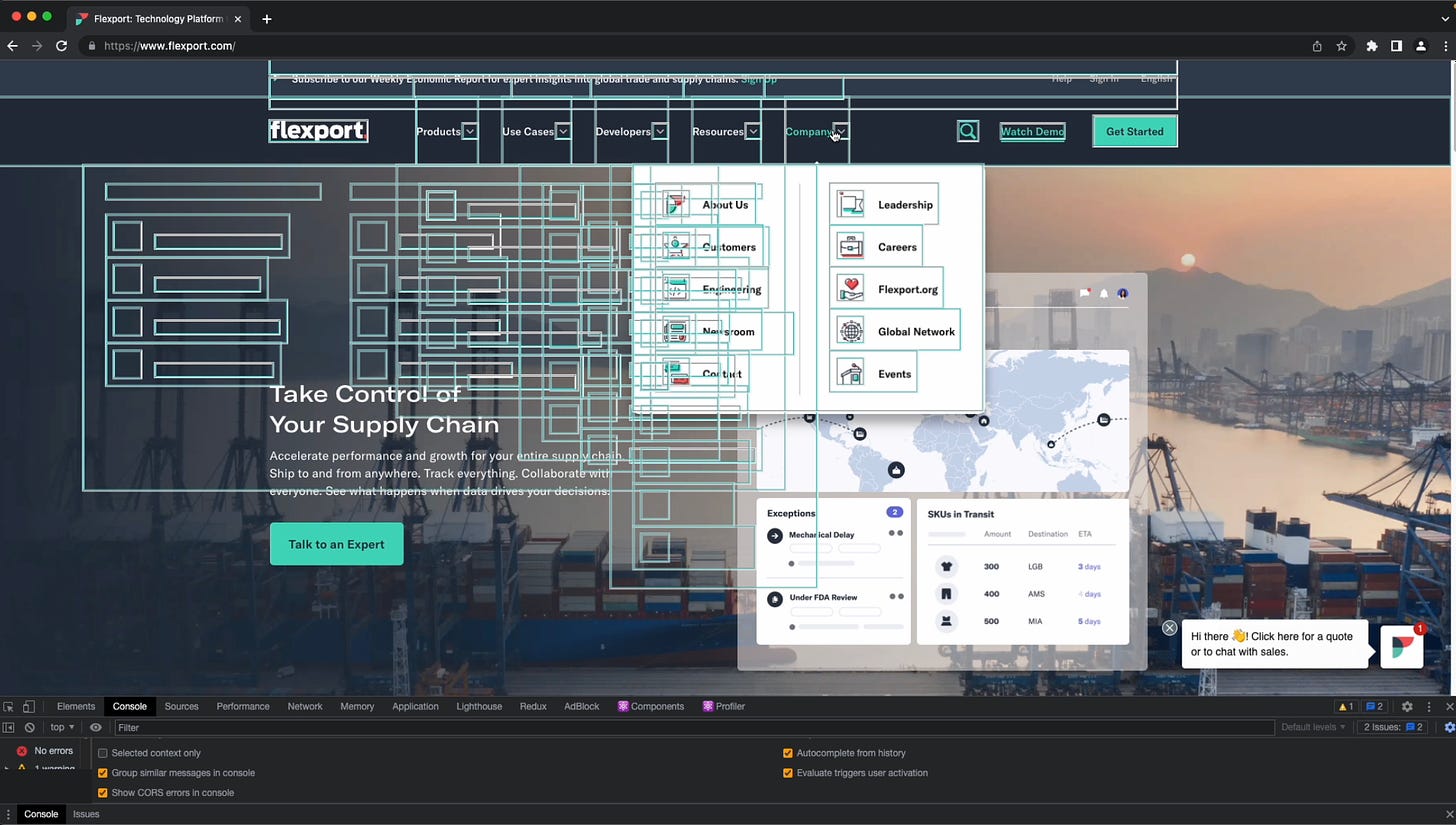
Some re-renders are not worth optimizing because they have minimal effects on performance. And you might think that this might be the case here as well. I decided to use Chrome’s built-in performance monitoring tool to see if this really affected performance by a noticeable amount.
The performance tab on Chrome’s dev tools allows you to analyze the runtime performance of a page. Although a page might do well on the lighthouse test, it doesn’t mean it will have a good runtime performance. This article does a great job of explaining what the performance tab does in more detail.
This was the case with Flexport’s website. It did really well when I ran the lighthouse test on the site:
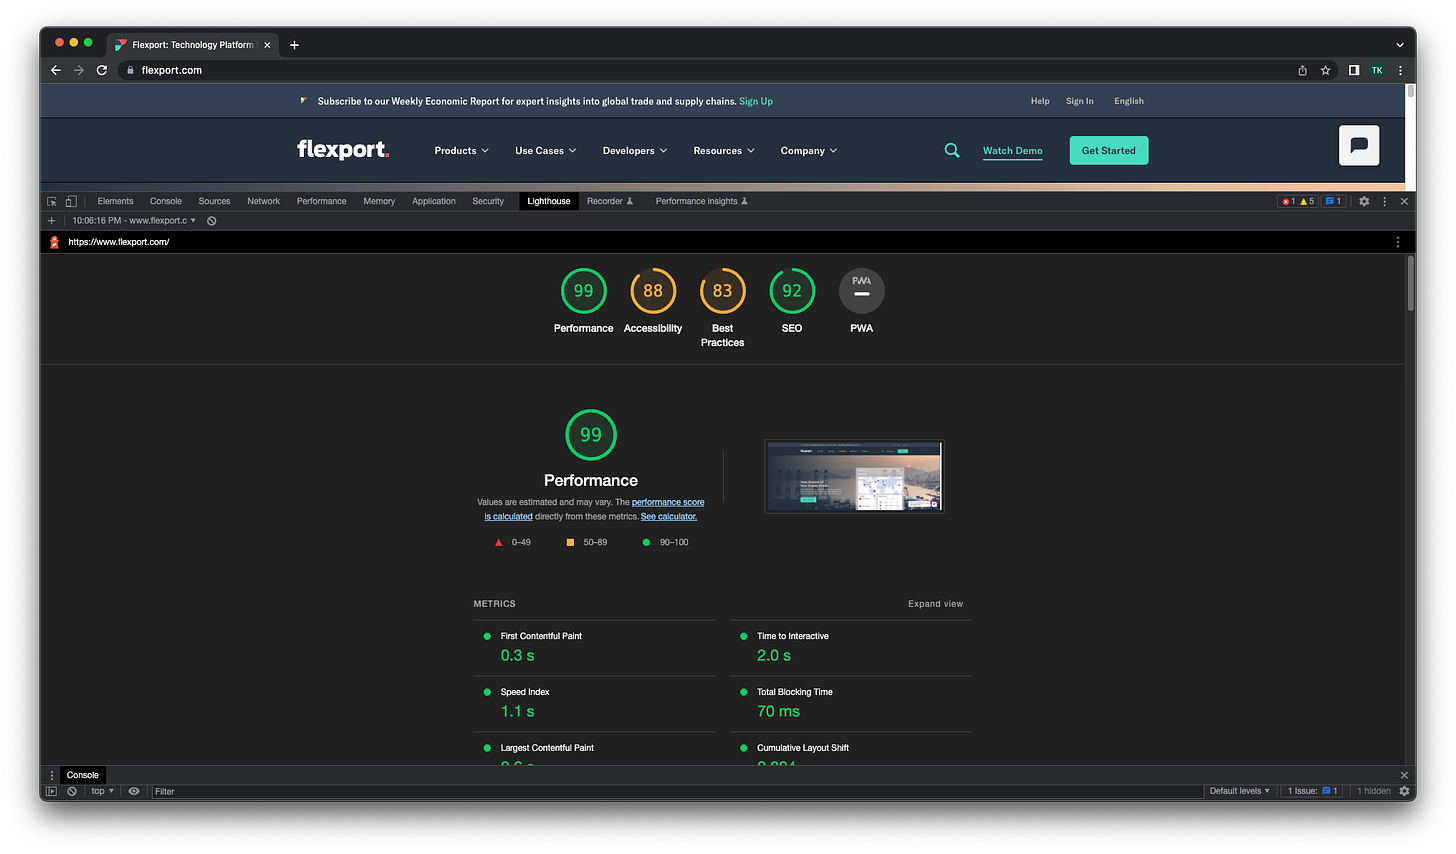
99 on the performance test is really good. However, analyzing the runtime performance truly shows the performance of the site when users interact with it.
I let Chrome record the performance metrics as I interacted with the navigation bar. For the first 5 seconds of the recording, I didn’t interact with the page to show the idle metrics of the site, then I started hovering over different elements of the navigation bar to see how they affect the performance of the web page. Here are the results:
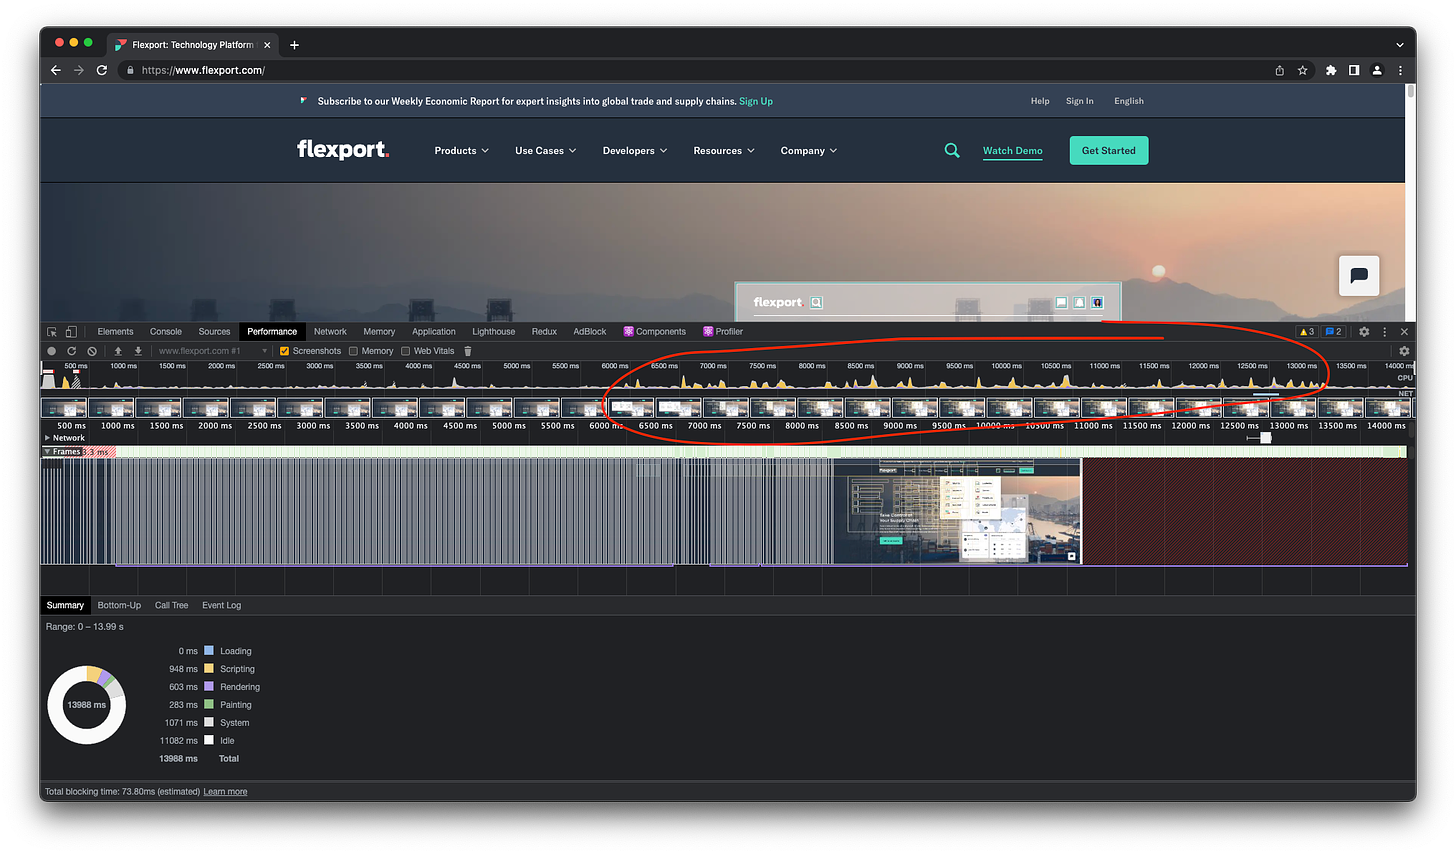

As you can see from the runtime performance, the CPU usage spiked a lot when I interacted with elements on the navigation bar (reaching more than 50%).
I should mention that Flexport uses a set of tools to monitor user sessions as users browse through their website (fullstory & Datadog’s session replay), which might’ve also contributed to the rise in CPU usage (requests are being sent to both services frequently). However, this doesn’t hide the fact that the component re-renders and inefficient state management are also performance bottlenecks.
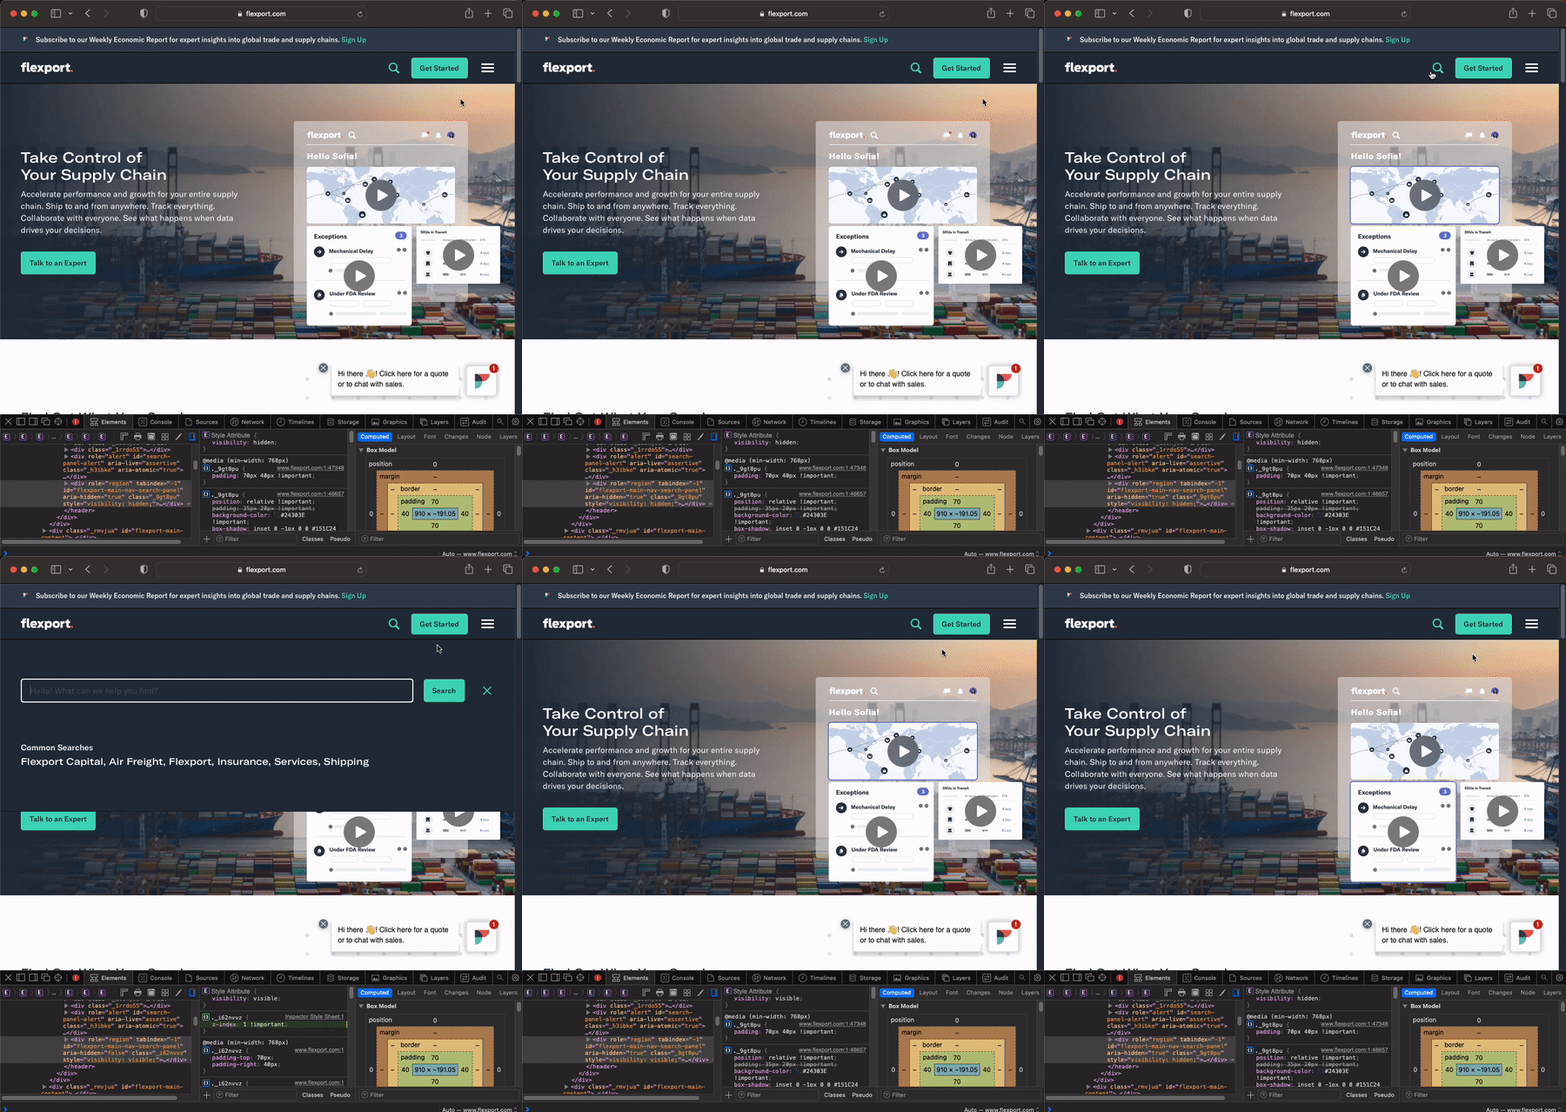
I noticed other bugs with the navigation bar while playing with it a bit. On Safari, with a medium/small screen-sized device, the search menu would flicker when you click on it, disappearing right after (this only happened on Safari. You can test this with an iPhone, or resize the window to be small enough that the media query that adjusts the navigation bar takes place).

Different browsers parse documents differently, and I’m not sure what was the reason that this only happened in Safari. Anyways, I looked more into the issue again and figured that it can be fixed by setting the z-index on that component properly.

That’s all I found.
To put my front-end skills to the test, I rebuilt Flexport’s navigation menu from scratch, using the same front-end library, React.js. I included the same styles and animations, but de-coupled the components so each one manages its own necessary state. This way, fewer re-renders happen, causing it to be more performant. You can check my rebuilt version here: https://nav-menu.vercel.app.

Runtime performance of nav-menu.vercel.app
I ran the same run-time performance test on https://nav-menu.vercel.app, and you can see a drastic improvement in CPU utilization. There are no noticeable spikes when navigating around the menu bar.